OJBTM
Online Journal of Bioinformatics ©
7 (1) : 22-31, 2006
Classification of incipient Alzheimer patients using gene expression data:
Dealing with potential
misdiagnosis
Robbins K1, Joseph S1, Zhang W1, Rekaya R1,2, Bertrand JK1
1Department of Animal and Dairy
Science, 2Department of Statistics University of Georgia, Athens, Georgia USA.
ABSTRACT
Robbins K,
Joseph S,
Zhang W,
Rekaya R,
Bertrand JK, Classification
of incipient Alzheimer patients using gene expression data: Dealing with
potential misdiagnosis,
Online Journal of Bioinformatics 7 (1) :
22-31, 2006. A latent-threshold model
and misclassification algorithm were implemented to predict the Alzheimer’s
disease (AD) status of 16 subjects using gene expression data. Each of the 16
subjects was initially classified as healthy or incipient AD using clinical
tests. To examine possible age effects on the diagnosis of incipient AD, two
datasets were created containing the age unadjusted (D1) and age adjusted (D2)
expression of the 100 most informative genes. Control and incipient subjects
were clustered into old and young age classes which were then used for age
adjustments. Results obtained without invoking the misclassification algorithm
showed limited predictive power of the model using either D1 or D2. When the
misclassification algorithm was invoked, four subjects were identified as being
potentially misdiagnosed. Results obtained after adjustment of the AD status
(switching of the binary status) of these four samples showed a significant
increase in the model’s predictive ability. Further examination of the
misdiagnosed samples, using plots and
![]() tests, showed that the gene expression
of these samples agreed more with the new than the initial classification.
Similar results were obtained using either D1 or D2. Interestingly, all of the
misdiagnosed subjects were originally classified as either an old control or a
young incipient. These results suggest that gene expression can be used to
improve AD diagnosis by identifying potentially misdiagnosed subjects in the
training set. Moreover, it was found that age may have little influence on genes
highly correlated with AD status, but it could affect diagnosis based on
clinical tests.
tests, showed that the gene expression
of these samples agreed more with the new than the initial classification.
Similar results were obtained using either D1 or D2. Interestingly, all of the
misdiagnosed subjects were originally classified as either an old control or a
young incipient. These results suggest that gene expression can be used to
improve AD diagnosis by identifying potentially misdiagnosed subjects in the
training set. Moreover, it was found that age may have little influence on genes
highly correlated with AD status, but it could affect diagnosis based on
clinical tests.
Key words: Latent-threshold model, Misclassification algorithm, Alzheimer’s disease
INTRODUCTION
Alzheimer’s disease (AD) is a degenerative disease of nerve cells in the cerebral cortex that leads to atrophy of the brain and senile dementia. Patients with this devastating disorder lose their ability to encode new memories, first of trivial and then of important details of life. AD is the most common form of age-related dementia and one of the most serious health problems in the USA. AD is a major cause of loss of intellectual function in middle-aged and elderly people. The number of individuals with AD is expected to approach 14 million by the year 2050. In 1998, the annual cost for the care of patients with AD in the United States was approximately $40,000 per patient.
While symptoms for AD are well defined and very pronounced in later stages of the disease, diagnosis of patients with incipient AD has proven to be somewhat difficult. The Mini-Mental State Exam (MMSE) is one clinical test used to detect the presence of AD, however the effects of normal aging can be confounded with the effects of AD in incipient cases when using cognitive tests such as MMSE (Ashe, 2000; Glasko et al., 1990). Neurofibrillary tangles (NFT) are another common AD indicator used to aid in the confirmation of AD diagnosis; however some recent studies have shown that NFT may be associated with normal aging, and may not be sufficient for accurate diagnosis of AD (Haroutunian et al., 1999; Price and Sisodia, 1998; Schmitt et al., 2000; Snowdon, 1997).
Although indicators of AD, such as MMSE and NFT, are not highly effective in detecting the presence of incipient AD, neuropathological data indicate that the brain changes associated with AD begin well before clinical symptoms are established (Price and Sisodia, 1998). This coupled with evidence that many genes play a role in the development of AD, suggest that the use of genetic information, such as gene expression, could yield more accurate diagnosis of incipient AD (Goate et al., 1991; Scheuner et al., 1996; Tanzi, 1999).
The use of microarray expression profiling for the classification and subtype discovery of diseases has been proposed and frequently investigated; however, such algorithms work under the assumption that all classifications in the training set are correct (Dudoit et al., 2002; Golub et al., 1999; Khan et al., 2001; Yeoh et al., 2002). In cases where the diagnostic tools for classification of training samples are not highly reliable, as with MMSE, this assumption may not hold true. If training samples are in fact misclassified, these algorithms may select genes that have little or no predictive ability. Zhang et al. (2006) found that when misclassification occurred in the training set, the predictive ability of the algorithm used was greatly reduced. In cases where the certainty of training sample classification is in question, a method to identify and correct potential
misclassifications may be needed to effectively predict disease status.
For this study a threshold model and misclassification algorithm were implemented, utilizing both age adjusted and age unadjusted gene expression, to identify subjects that were misclassified using clinical diagnostic tools, to predict disease status, and to examine the effects of age on the diagnosis and onset of incipient AD.
MATERIALS AND METHODS
The dataset used for this study contained gene expression measures on mRNA extracted from hippocampus brain tissue, MMSE scores, NFT scores, and age at death for 31 subjects. Methods for mRNA extraction, calculation of the average difference of probe set intensities, and disease classification, based on MMSE and NFT, are described by Blalock et al. (2004). A summary of the data can be found in Table 1.
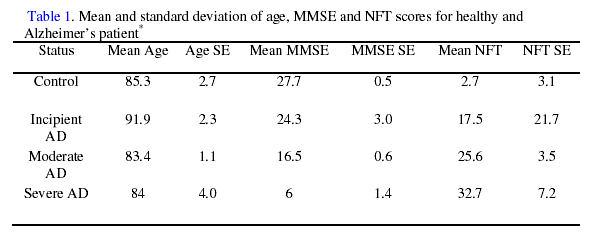
* AD = Alzheimer’s Disease. MMSE = Mini-Mental Status Examination. NFT = Nerofibrilliary tangles. For this study,
only control and incipient AD subjects were used for analysis.
Two datasets were created for use in predicting disease status. The first dataset (D1) contained the natural log of the average difference of probe set intensities (LGE). To examine any effects of aging on the expression of AD related genes, a dataset containing age adjusted LGE was created (D2). However, due to the large difference in the mean ages of healthy and incipient AD subjects (Table 1) the modeling of age directly as a
covariate was problematic. It should be noted that this confounding did not exist between control and more advanced cases of AD as presented in Table 1. To address this problem, subjects in the control and incipient AD classes were placed into young and old age groups. Using these classes, the LGE for each gene was adjusted using the following fixed effect model:
where LGEijklm is the log gene expression for subject k; agei is the age class i; statusj is the disease status j; age*statusij is the interaction of age i and disease status j; and eijk the random residual. Using the estimates from equation (1), the age adjusted LGE were calculated as:
![]()
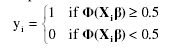
A Bayesian regression model, as developed by West (2001), was used to predict disease status in the form of a probability pi(yi=1), with yi = 1 indicating an incipient AD disease status for subject i and yi = 0 indicating a healthy status. The regression on the vector of binary response y was done using a latent variable model, with li being an unobserved, continuous latent variable relating to binary response yi such that:
The liability li was modeled using a linear regression model as:
where Xi corresponds to row i of the matrix X, containing explanatory responses. The link function of the expectation of the liability X,β with the binary response yi was constructed via a probit model yielding the following equations (West, 2003):
![]()
where
![]() is the standard normal
distribution function, yielding the following relationships:
is the standard normal
distribution function, yielding the following relationships:
For this application the explanatory responses contained in the matrix X were the LGE of the test subjects. Genes were selected based on differential expression and the correlations between LGE and the binary responses of subjects in the training set and differential expression. The 100 most influential genes were selected and then used to estimate regression coefficients or gene effects in the vector β. The process for gene selection was repeated for each replication of the validation procedure.
Due to the fact that 100 genes were used, the dimensions of X and β were much larger then the number of binary response in y, thus creating the need to perform a dimension reduction on X and β. This was done using singular value decomposition (SVD) such that:
![]()
where X is the n (number of samples) by m (number of genes) matrix of LGE, Q is an n by n orthogonal matrix, D is an ordered n by n diagonal matrix, and P is an m by m orthogonal matrix, where the first n columns of P are the right-hand singular vectors of X. Using the results of the SVD on X, equation (3) can be re-written in matrix vector notation as:
![]()
where
![]() an nx1 vector of "super" gene effects. Further,
an nx1 vector of "super" gene effects. Further,
![]()
where
l
is a vector of n liabilities corresponding to n binary responses in the vector
y; Qi is row
i of the matrix Q, and
![]() is equal to P'β The
predictive ability of this model was tested using a "leave one out" validation
is equal to P'β The
predictive ability of this model was tested using a "leave one out" validation
procedure, in which the binary response for one subject was treated as unknown, and regression coefficients were calculated using the remaining n-1 subjects in the training dataset. The estimated coefficients were then used to predict the disease status for the record being treated as missing. This process was repeated until each of the 16 subjects had been treated as having missing records and subsequently had their disease status
predicted.
To examine the possibility of misdiagnosis, the probability if miscoding (PM) was calculated for each sample in the validation data set using a Bayesian approach derived by Rekaya et al. (2001). Let r be an unobserved vector of the "true" binary outcomes (incipient=1, control=0) of samples in the training set, which can be viewed as a realization of the vector y, and, as such, are bound by equation (7) and classification rule (8). Assume the observed vector of binary outcomes, z, is a noisy realization of r, where one or more of the binary outcomes are potentially misdiagnosed or misclassified.
Misclassification occurs if some elements of z are switched from the "true" binary response in r, such that zi does not equal ri. Let m be a vector of indicator variables, where mi = 1 if observation i is misclassified and
mi = 0 otherwise. Each element of m and r can be
modeled using a Bernoulli process, such that, assuming independence, their joint
distribution, given ![]()
![]()
where
![]() is the probability of a misdiagnosis or misclassification occurring in the
training set;
and
is the probability of a misdiagnosis or misclassification occurring in the
training set;
and ![]() is the probability that subject ri
has
incipient AD. Using
the relationship between ri and zi , given mi , derived as:
is the probability that subject ri
has
incipient AD. Using
the relationship between ri and zi , given mi , derived as:
![]()
coupled with equation (9), the conditional posterior distribution of i m is given by:
![]()
and
![]()
![]()
Assuming a Beta(1,3) as a prior for
![]() , its conditional distribution is easily
obtained as:
, its conditional distribution is easily
obtained as:
![]()
All
estimates of model parameters were obtained using a fully Bayesian approach (Rekaya
et al., 2001; West et al., 2001; Zhange et al., 2006). Using the binomial
approximation the normal distribution z-scores were calculated from the PM for
each sample
in the training set. The z-score with the highest absolute value (z*) was
selected and
then compared to the threshold
![]() . It was assumed that the misclassification of
subjects in the training set would be a rare event and as such
. It was assumed that the misclassification of
subjects in the training set would be a rare event and as such
![]() was set to
0.05. If z*>
was set to
0.05. If z*> ![]() , using a
one-sided test, the subject was identified as being potentially misclassified.
This subject
was then reclassified, and the validation step was repeated using the new
classification. This process was repeated until no additional samples were
identified as being
potentially misclassified.
, using a
one-sided test, the subject was identified as being potentially misclassified.
This subject
was then reclassified, and the validation step was repeated using the new
classification. This process was repeated until no additional samples were
identified as being
potentially misclassified.
To examine the accuracy of the reclassification process, a subset of D1 was created that contained only samples that were not identified as being miscoded and were correctly classified in cross validation. This dataset (D3) contained four incipient AD and five healthy subjects. Using D3, the 25 genes most highly correlated with the disease status were selected. The mean LGE, for each gene, was computed for incipient (MI) and
control
(MC) samples, and an overall mean expression (MO) computed by averaging MI and MC.
The LGE of reclassified samples, MI, and MC were deviated from MO and
plotted. The number of times the reclassified samples fell on the incipient and
control sides
of MO, respectively, were summed, discarding LGE with absolute values less than
0.05 when deviated from MO, and used to calculate the
![]() as follows:
as follows:
![]()
Where nc is the number of times the LGE fell on the control side of MO; ni is the number of times the LGE fell on the incipient side of MO; and mc is the average of nc and ni.
RESULTS AND DISCUSSION
The ranges of MMSE and NFT scores, given in Table 2, show large overlapping regions between the scores for control and incipient AD groups.
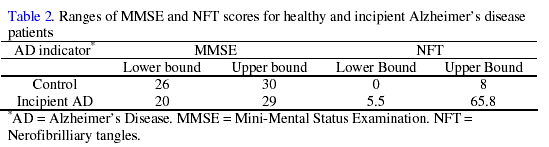
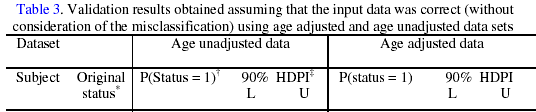
Clearly there are no well defined borders separating control and incipient AD, which could make diagnosis difficult when using these clinical tests. This seems to be reflected by the initial validation results found in Table 3.
1
1
0.12
0.00
0.58
0.08
0.00
0.40
2
1
0.90
0.48
1.00
0.82
0.25
1.00
3
0
0.14
0.00
0.66
0.15
0.00
0.68
4
1
0.05
0.00
0.52
0.11
0.00
0.55
5
0
0.12
0.00
0.89
0.32
0.00
0.91
6
0
0.50
0.05
1.00
0.22
0.00
0.83
7
0
0.41
0.00
0.96
0.40
0.00
0.95
8
0
0.50
0.00
0.82
0.19
0.00
0.78
9
0
0.44
0.00
0.97
0.20
0.00
0.78
10
1
0.55
0.03
1.00
0.53
0.03
1.00
11
1
0.31
0.02
1.00
0.23
0.00
0.82
12
0
0.83
0.11
1.00
0.81
0.24
1.00
13
1
0.73
0.12
1.00
0.74
0.14
1.00
14
0
0.30
0.03
1.00
0.55
0.03
1.00
15
0
0.93
0.69
1.00
0.93
0.65
1.00
16
1
0.32
0.00
0.92
0.15
0.00
0.67
* Alzheimer’s disease status based on clinical tests (0 = healthy; 1= incipient AD).
† probability of an individual being incipient AD. ‡ High probability density interval 90%
for the classification probability (L = Lower bound, U= Upper bound).
When using either D1 or D2, the model had little power to correctly predict disease status given the original disease classification based on MMSE and NFT scores. In fact, when using D1, 6 out of 16 samples had their disease status wrongly predicted and an additional 2 samples, 6 and 8, could not be classified as their
p(status =1) were equal to 0.5 resulting in an accurate classification probability of 50%. Similar results were
observed when D2 (age adjusted expression) was used. These results are in concordance with the conclusions of Glasko et al. (1990) who found that MMSE was not sensitive to the presence of early AD. Furthermore previous microarray studies have found differential expression between healthy and Alzheimer’s disease (AD) subjects for several genes, and Ashford and Mortimer (2002) concluded that non-familial AD is mainly a genetic disease (Loring et al. 2001; Ricciareli et al., 2004). This combined with the overlapping of AD indicators used for the classification of subjects in this dataset, suggests that the poor predictability of the model may be due, in large part, to potential misdiagnosis or misclassification in the training data set.
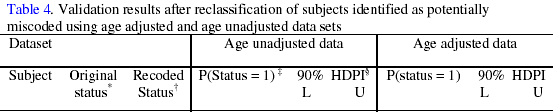
When potential misdiagnosis in the training set was postulated in the statistical model, four samples, subjects 4, 10, 12, and 15, were identified as being misclassified. Table 4 shows that, after iteratively reclassifying (switching of their binary status) of these four subjects, there were large increases in the prediction accuracy of the model using both datasets.
1
1
1
0.72
0.11
1.00
0.82
0.28
1.00
2
1
1
0.97
0.97
1.00
0.97
0.99
1.00
3
0
0
0.11
0.00
0.57
0.11
0.00
0.56
4
1
0
0.04
0.00
0.17
0.05
0.00
0.18
5
0
0
0.11
0.00
0.54
0.12
0.00
0.57
6
0
0
0.50
0.03
1.00
0.46
0.00
0.96
7
0
0
0.87
0.39
1.00
0.86
0.36
1.00
8
0
0
0.56
0.04
1.00
0.56
0.04
1.00
9
0
0
0.07
0.00
0.35
0.06
0.00
0.24
10
1
0
0.27
0.00
0.87
0.33
0.00
0.92
11
1
1
0.37
0.00
0.81
0.28
0.00
0.86
12
0
1
0.92
0.61
1.00
0.94
0.67
1.00
13
1
1
0.86
0.37
1.00
0.85
0.33
1.00
14
0
0
0.30
0.00
0.90
0.30
0.00
0.89
15
0
1
0.91
0.57
1.00
0.91
0.55
1.00
16
1
1
0.83
0.27
1.00
0.83
0.26
1.00
* Alzheimer’s disease status based on clinical tests (0 = healthy; 1= incipient AD).
†Predicted Alzheimer’s disease status (0 = healthy; 1= incipient AD). ‡ probability of an
individual being incipient AD. § High probability density interval 90% for the
classification probability (L = Lower bound, U= Upper bound).
It can be seen that in addition to the four reclassified subjects, the predictions for subjects 1 and 16 went from being incorrect to correct after reclassification. In fact, only three samples (subjects 8, 7, and 11) had their disease status wrongly classified using either D1 or D2 and an additional sample (subject 6) was not conclusively classified using D1.
Based on these results, the consideration of potential misdiagnosis in the statistical model has increased the prediction power of the model from 50 to 75% and from 56 to 81% using D1 and D2, respectively. The predictions for subjects 6 and 8 changed little after reclassification, both remaining near 0.50 when using D1, suggesting, perhaps, that the gene expression measures of these subjects follow an irregular pattern unlike those of healthy and incipient AD subjects. The density plots of the posterior distributions of subjects 8 and 6 (results not shown), unlike all other subjects, were relatively flat, suggesting the LGE contributed little information to the sampling of their liabilities, possibly due to hybridization problems or additional heterogeneity in gene expression not accounted for when using binary classifications.
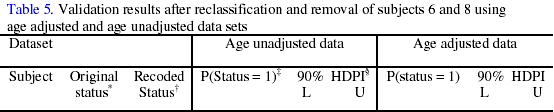
In order to further investigate, a validation was conducted excluding these subjects. As can be seen in Table 5, the exclusion of these subjects had only small effects on the model’s predictive ability, suggesting that these subjects had only a minor influence on the gene selection process.
1
1
1
0.82
0.25
1.00
0.80
0.22
1.00
2
1
1
0.94
0.76
1.00
0.93
0.71
1.00
3
0
0
0.12
0.00
0.59
0.12
0.00
0.59
4
1
0
0.05
0.00
0.18
0.05
0.00
0.19
5
0
0
0.11
0.00
0.55
0.12
0.00
0.57
7
0
0
0.84
0.26
1.00
0.85
0.32
1.00
9
0
0
0.10
0.00
0.47
0.06
0.00
0.26
10
1
0
0.38
0.00
0.94
0.37
0.00
0.92
11
1
1
0.37
0.00
0.94
0.27
0.00
0.87
12
0
1
0.92
0.61
1.00
0.91
0.57
1.00
13
1
1
0.78
0.20
1.00
0.77
0.19
1.00
14
0
0
0.41
0.00
0.94
0.37
0.00
0.99
15
0
1
0.83
0.27
1.00
0.83
0.27
1.00
16
1
1
0.79
0.20
1.00
0.80
0.21
1.00
* Alzheimer’s disease status based on clinical tests (0 = healthy; 1= incipient AD). † predicted Alzheimer’s disease status (0 = healthy; 1= incipient AD). ‡ probability of an individual being incipient AD. § High probability density interval 90% for the classification probability (L = Lower bound, U= Upper bound).
With
the exception of subject 8, the only subject that was correctly classified prior
to
recoding and incorrectly classified after recoding was subject 7. It should be
noted that when ![]() was relaxed to 0.08 subject 7 was identified as being miscoded, however, when
was relaxed to 0.08 subject 7 was identified as being miscoded, however, when
![]() was set
to 0.1 the algorithm deteriorated to a state in which previously recoded samples were
continuously switched between the two disease statuses. This yielded results
with little
interpretive value, and suggested the need for more conservative levels of
was set
to 0.1 the algorithm deteriorated to a state in which previously recoded samples were
continuously switched between the two disease statuses. This yielded results
with little
interpretive value, and suggested the need for more conservative levels of
![]() to prevent
recoding of subjects that were correctly classified using MMSE and NFT scores.
to prevent
recoding of subjects that were correctly classified using MMSE and NFT scores.
Based
on these results it is clear that the model performance improved after recoding
subjects 15, 4, 12, and 10. In
addition to the recoded samples,
![]() values were calculated for two subjects
strongly
believed to be correctly classified as healthy and incipient (AD). These
reference samples were
removed from D3 when selecting genes for calculation of their respective
values were calculated for two subjects
strongly
believed to be correctly classified as healthy and incipient (AD). These
reference samples were
removed from D3 when selecting genes for calculation of their respective
![]() values.
The
values.
The ![]() values for samples 15, 4, and 12 were highly significant, with the
majority of the gene expression values in agreement with the recoded status as
seen in Table
6.
values for samples 15, 4, and 12 were highly significant, with the
majority of the gene expression values in agreement with the recoded status as
seen in Table
6.
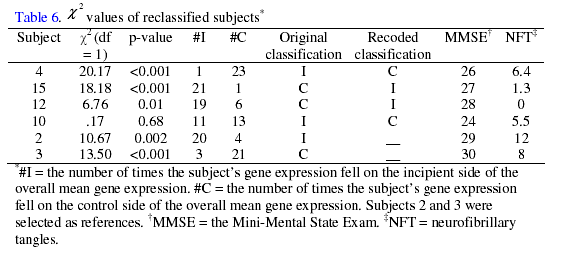
When
compared to the ![]() values of the reference subjects 3 and 2, the LGE of these recoded
subjects appear to fit the reclassified status significantly better than their
initial status.
Although the reference samples did not have the most significant
values of the reference subjects 3 and 2, the LGE of these recoded
subjects appear to fit the reclassified status significantly better than their
initial status.
Although the reference samples did not have the most significant
![]() values, as
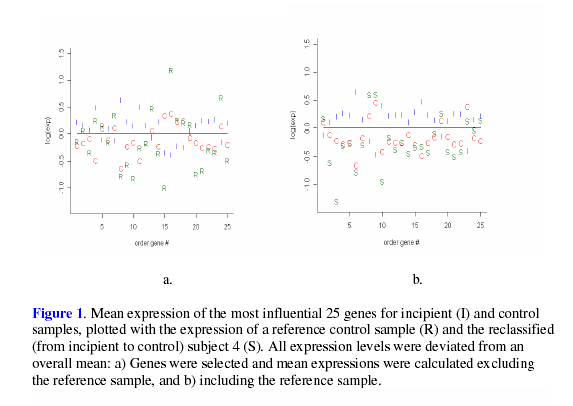
expected, plots of LGE shown in Figure 1 and
Figure 2 show that, on average, the LGE of the
reclassified samples were closer to MO then than the LGE of the reference
values, as
expected, plots of LGE shown in Figure 1 and
Figure 2 show that, on average, the LGE of the
reclassified samples were closer to MO then than the LGE of the reference
subjects.
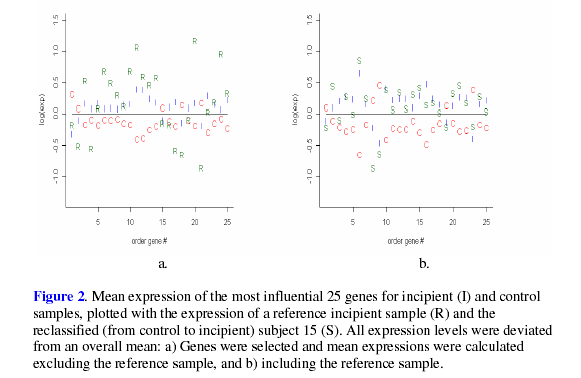
Despite
the fact that the ![]() value for subject 10 was insignificant, its expression
agreed with
the recoded status more than with the original classification. While the LGE of subject
10 appear to be somewhat ambiguous when utilizing D3 to select genes, it seems that
this subject’s LGE agree more with the reclassified status when using all data,
as shown
by the validation result in Table 4. In addition to the LGE, the MMSE and NFT scores
were examined for each of the reclassified samples. It was found that all of the recoded
samples were within the range of the recoded status for MMSE or NFT, with subject
15 being within the range of both the MMSE and NFT for its recoded status. Such results
lend support to the reclassification of these four samples.
value for subject 10 was insignificant, its expression
agreed with
the recoded status more than with the original classification. While the LGE of subject
10 appear to be somewhat ambiguous when utilizing D3 to select genes, it seems that
this subject’s LGE agree more with the reclassified status when using all data,
as shown
by the validation result in Table 4. In addition to the LGE, the MMSE and NFT scores
were examined for each of the reclassified samples. It was found that all of the recoded
samples were within the range of the recoded status for MMSE or NFT, with subject
15 being within the range of both the MMSE and NFT for its recoded status. Such results
lend support to the reclassification of these four samples.
Given the small sample size and the confounding of age with disease status, as seen in Table 1, it is difficult to construe the actual effect of age on MMSE, NFT, and LGE. One possible explanation for the similar performances of D1 and D2 is that age has little effect on the expression levels of the genes most highly correlated with AD status. This seems to be supported by the fact that, on average, the age class effects were less than 1.5% of the magnitude of the mean expression for selected genes, suggesting that differences in predictions between D1 and D2 could be the result of random noise added by age adjusting the LGE. The fact that all four of the recoded subjects were classified as either an old control or a young incipient could indicate that there may be some type of relationship between age, NFT, and MMSE, possible resulting in a higher rate of misdiagnosis of patients in these categories. Previous studies have shown that age does affect AD indicators such as cognitive decline and NFT, but that these indicators do not necessarily signal the onset of AD. Chen and Fernandez (2000) concluded age was a risk factor for the onset of AD due to decreases in Ca2+ signaling in older individuals. These decreases in signaling led to accumulation of amyloid plaques and NFT, both major indicators of AD. Snowdon (1997), however, found that active individuals were less likely to develop AD despite large amounts of amyliod plaques and NFT. In a study using transgenic mice, Ashe (2000) concluded that a major difficulty in determining the relationship between cognitive decline and molecular markers was an inability to distinguish between age-dependent and age-independent effects.
Another plausible explanation for the similarities between the performances of D1 and D2 is the inability to effectively model age as a covariate resulted in uninformative age adjustments. The age classes used to create D2 may have only partially accounted for the age effect. If this were the case, the small differences observed when using D2 versus D1 could be the result of the partial accounting for the age effect, with the full effect of age being unobserved. Similarly, the pattern of misdiagnosis using clinical data could simply be artifacts of the data resulting from the small sample size. This may be supported by the fact that, if it is expected that MMSE decreases with age and NFT increases, misclassification would most likely occur when a subject was initially classified as a young control or an old incipient. Clearly, given the confounding of age with disease status and the small sample size, further investigation is needed to confirm the effect of age on the diagnosis of incipient AD when using gene expression or clinical tests.
Due to the overlapping of AD indicators between healthy and incipient AD subjects, and the possible effects of age, MMSE and NFT may not be adequate measures for diagnosis of incipient AD. The use of LGE, coupled with the reclassification algorithm, appeared to greatly increase the accuracy of incipient AD diagnosis. While the use of LGE showed improved performance over traditional AD makers, utilization of such data for disease diagnosis is impractical, as it would require the collection of brain tissue for expression analysis. However, the treatment of AD in its early stages will require a better understanding of the genes involved in the development of incipient AD. Microarray studies provide an excellent tool for accomplishing such a task, but if multiple subjects
are misclassified, as it appears was the case with these data, such studies would have little power to detect differential expression. The use of this algorithm as a preprocessing step for analysis of microarray data, in which miscoding is suspected to be present, could increase the power of detecting differentially expressed genes. In fact, preliminary results form mixed model analysis of gene expression detected no AD related genes as
differentially expressed when using the original classifications; however, when the statuses of the 4 subjects identified as being misclassified were switched, differential expression of several AD related genes was detected. One such gene associated with amyloid plaques, VILIP-1, was found to down regulated, which is in agreement with findings by Schnurra et al.(2001)
From the results of this study it is clear that MMSE and NFT are inadequate for diagnosis of incipient AD. Conversely it was shown that the misclassification algorithm was capable of identifying miscoded data, and that the utilization of LGE can more accurately predict disease status, possibly allowing for more powerful microarray analysis. Additionally the similar performances of D1 and D2 may suggest that the effects of age are limited to AD markers such as MMSE and NFT, and have little effect on the expression of the genes most highly correlated with the onset of AD. However, further research with a larger and more balanced dataset is needed to confirm the effects of age on the onset of incipient AD.
Acknowledgments
We would like to thank Dr. Eric M. Blalock for providing us with the data used for this study.
REFERENCES
Ashe, K. H. (2000). Learning and Memory in Transgenic Mice Modeling Alzheimer's Disease, Learning & Memory, 8(6), 301-308.
Ashford, J. W. and Mortimer, J. A. (2002) Non-familial Alzheimer's disease is mainly due to genetic factors, Journal of Alzheimer's disease, 4, 169-77.
Blalock, E. M., Geddes, J. W., Chen, K. C., Porter, N. M., Markesbery W. R. and Landfield, P W. (2004). Incipient Alzheimer's disease: microarray correlation analyses reveal major transcriptional and tumor suppressor responses, Proceedings of the National Academy of Sciences, 101, 2173-8.
Chen, M. and Fernandez, H. L. (2000) How Important are Risk Factors in Alzheimer's Disease, Journal of Alzheimer's disease, 2, 97-108.
Dudoit, S., Fridlyyand, J. and Speed, T. (2002). Comparison of discrimination methods for classification of tumors using gene expression data, Journal of the American Statistical Association, 97, 77-87.
Galasko, D., Klauber, M. R., Hofstetter, C. R., Salmon, D.P., Lasker, B. and Thal, L.J. (1990). The Mini-Mental State Examination in the early diagnosis of Alzheimer's disease, Archives of Neurology, 47, 49-52.
Goate, A., Chartier-Harlin, M. C., Mullan, M., Brown, J., Crawford, F. and Fidani, L. (1991). Segregation of a missense mutation in the amyloid precursor protein gene with familial Alzheimer's disease, Nature, 349, 704-6.
Golub, T. R., Slonim, D. K., Tamayo, P., Huard, C., Gassenbeek, M., Mesirov, P., Coller, H., Loh, M. L., Downing, J. R. Caligiuri, M. A. (1999) Molecular classification of cancer: class discovery and class prediction by gene expression monitoring, Science, 286, 531-7.
Haroutunian, V., Purohit, D. P., and Perl, D. P. (1999). Neurofibrillary tangles in nondemented elderly subjects and mild Alzheimer disease, Archives of Neurology, 56(6), 713-8.
Khan, J., Wei, J. S., Ringner, M., Saal, L. H., Ladanyi, M., Westermann, F., Berthold, F., Schwab, M., Antonescuy, C. R., Peterson, C. and Meltzer, P. S. (2001). Classification and diagnostic prediction of cancers using gene expression profiling and artificial neural networks, Nature Medicine, 7, 673-9.
Loring, J. F., Wen, X., Lee, J. M., Seilhamer, J. and Somogyi R. (2001). A gene expression profile of Alzheimer's disease, DNA and Cell Biology , 20, 683-95.
Price, D. L. and Sisodia, S. S. (1998). Mutant genes in familial Alzheimer's disease and transgenic Models, Annual Review of Neuroscience, 21, 479-505.
Rekaya, R., Weigel, K. A. and Gianola, D. (2001). Threshold model for misclassified binary responses with applications to animal breeding, Biometrics, 57, 1123-9.
Ricciarelli, R., d'Abramo, C., Massone, S., Marinari, U., Pronzato, M. and Tabaton, M. (2004). Microarray analysis in Alzheimer's disease and normal aging, International Union of Biochemistry and Molecular Biology Life, 56, 349-354.
Scheuner, D., Eckman, C., Jensen, M., Song, X., Citron, M. and Suzuki, N. (1996) Secreted amyloid beta-protein similar to that in the senile plaques of Alzheimer's disease is increased in vivo by the presenilin 1 and 2 and APP mutations linked to familial Alzheimer's disease, Nature Medicine 1996, 2, 864-70.
Schmitt, F. A.,Davis, D. G., Wekstein, D. R., Smith C. D., Ashford, J. W., Markesbery, W. R. (2000). Preclinical" AD revisited: neuropathology of cognitively normal older adults, Neurology, 55, 370-6.
Schurra, I., Berstein, H. G., Reiderer, P. and Braunewell K. H. (2001) The neuronal Calcium sensor protein VILIP-1 is associated with amyloid plaques and extracellular tangles in Alzheimer’s Disease and promotes cell death and tau phosphorylation in vitro:A link between calcium sensors and Alzheimer’s disease, Neurobiology of Disease, 8,
900-9.
Snowdon D A. (1997). Aging and Alzheimer's disease: lessons from the Nun Study, Gerontologist, 37, 150-6.
Tanzi, R. E. (1999). A genetic dichotomy model for the inheritance of Alzheimer's disease and common age-related disorders, The Journal of Clinical Investigation, 104, 1175-9.
West, M., Blanchette, C., Dressman, H., Huang, E. R., Ishida, S., Spang, R., Zuzan, H., Olson Jr, J. A., Marks, J. R. and Nevins, J. R. (2001) Predicting the clinical status of human breast cancer by using gene expression profiles, Proceedings of the National Academy of Sciences, 98, 11462-67.
West M. (2003). Bayesian factor regression models in the "Large p, Small n" paradigm, Bayesian Statistics, 7, 723-732.
Yeoh, E. J., Ross, M. E., Shurtleff, S. A., Williams, W. K., Patel, D., Mahfouz, R., Behm, F. G., Raimondi, S. C., Relling, M. V. and Patel, A. (2002) Classification, subtype discovery, and prediction of outcome in pediatric acute lymphoblastic leukemia by geneexpression Profiling, Cancer Cell, 1, 133-43.
Zhang W., Rekaya, R. and Bertrand, K. (2006). A method for predicting disease subtypes in presence of misclassification among training samples using gene expression: application to human breast cancer, Bioinformatics, 22, 317-25.